Data Design 4 Social Innovation in Renewable Energy Projects

The shift towards renewable energy is crucial in addressing global climate change, reducing carbon footprints, and fostering sustainable development. However, the transition is not without its challenges, particularly in terms of social acceptability and citizen participation. In this context, the SIreNERGY project, in collaboration with APESA and Bigbang Project, has developed a set of data design tools aimed at enhancing understanding and promoting social innovation in renewable energy initiatives. This article explores the structure, purpose, and potential applications of these tools, with a focus on the "maps" created as part of the holistic diagnoses carried out in partnership with regional stakeholders.
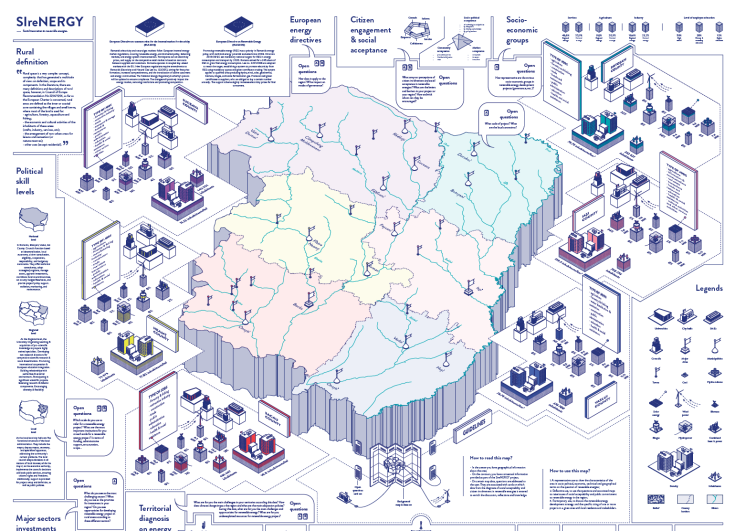
The maps designed under the SIreNERGY project serve as both informational and participatory tools. Their layout is intentionally structured to facilitate understanding and support stakeholder engagement. Each map is organized into five key sections:
-
Central Section: The heart of the map displays the geographic representation of the partner region. Key features like towns, rivers, ongoing renewable energy projects, and natural areas are marked to provide a clear visual context.
-
Upper Section: This area contains data related to European energy directives as well as the socio-economic characteristics of the population. It highlights how the broader European context interacts with the regional reality.
-
Right-hand Section: On the right side, detailed demographic data is presented, such as population density and employment types. This information helps stakeholders understand the human dimension of the region’s renewable energy landscape.
-
Left-hand Section: Definitions of key concepts, such as "rural" (tailored to the specific context of the region), are included here. Additionally, information on political competencies and main investment sectors provides insight into the institutional and financial environment.
-
Lower Section: This section features an energy diagnosis of the region, focusing on aspects like energy consumption, CO2 emissions, and significant environmental challenges. It offers a clear picture of the current energy landscape, highlighting areas of opportunity and concern.
To maximize the impact of these maps, it is essential to understand how they should be read and utilized. Here’s a guide to engaging with these innovative tools:
-
Understanding the Layout: As noted earlier, the map is divided into five sections, each focusing on specific themes. Users should start by exploring the central section to familiarize themselves with the geographical context. From there, they can move outward to understand the socio-political, economic, and technical dimensions.
-
Interactive Elements: Some elements of the map are interactive, marked with letters like “A” or “B”. These letters correspond to supplementary cards that address issues of social acceptability and citizen participation. For example, a card might pose a question related to procedural justice or community involvement. These cards serve as prompts for reflection, discussion, and participatory workshops.
-
Facilitating Workshops: The maps are ideal for use in stakeholder workshops. Facilitators can guide participants through the map’s various sections, encouraging them to reflect on the information presented. By utilizing the open-ended questions associated with the interactive elements, participants can delve deeper into the concepts of social acceptance and citizen engagement.
The maps offer a range of applications for different stakeholders, from government bodies to community groups and energy developers. Here are three primary modes of usage:
-
Representative Use: The maps provide a snapshot of the region’s socio-political, economic, technical, and geographical context. They can be used to present a comprehensive view of the region’s renewable energy landscape to policymakers, investors, or researchers.
-
Reflective Use: By utilizing the interactive elements and associated cards, stakeholders can reflect on the key questions of social acceptability and public commitment. This reflective process encourages deeper engagement and more inclusive decision-making.
-
Participatory Use: The maps can support participatory discussions on renewable energy development strategies. Stakeholders, including local residents, can be engaged in conversations about the siting of renewable energy projects, ensuring that their voices are heard and their concerns addressed.
The data design maps created under the SIreNERGY project are a powerful tool for promoting social innovation in renewable energy initiatives. By providing a comprehensive, interactive, and participatory approach to understanding regional energy landscapes, these maps facilitate greater stakeholder engagement and more inclusive decision-making.
Please check our library section! https://www.interregeurope.eu/sirenergy/library
